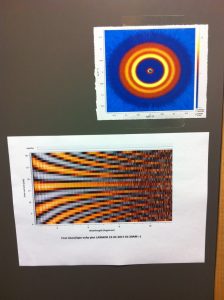
 We proudly pinned a new picture to the door of the measuring cabin of LARMOR. The top (circular) plot is a SANS pattern that is the basic mode of operation of the instrument.
Since 19-02-2017 we added a so called “Atari plot” to the functionality of LARMOR. This is a spin-echo phase plot as function of wavelength. The central horizontal stripe represents the constant echo phase for all wavelengths, which looks quite good!
Quality of the data is as expected, we can now officially say, SESANS is a operational mode of LARMOR!


